
Introduction
Infrastructure monitoring has traditionally been reactive. Monitoring platforms alert administrators when CPU, memory, or storage utilization exceeds predefined thresholds, but the responsibility for investigating and resolving the issue still falls on human operators.
As homelab enthusiasts, DevOps engineers, and system administrators, we’ve all experienced the same workflow:
- Receive an alert.
- Log in to the server.
- Check resource usage.
- Analyze logs.
- Implement a fix.
What if an AI agent could handle most of that process automatically?
With OpenClaw, an open-source autonomous AI agent framework, you can build a self-hosted monitoring agent that continuously watches your Proxmox infrastructure, detects CPU, memory, and disk utilization spikes, investigates the root cause through SSH, and emails you a detailed analysis report with remediation recommendations.
In this guide, you’ll learn how to deploy OpenClaw and configure an autonomous Proxmox monitoring agent from scratch.
What is OpenClaw?
OpenClaw is an open-source AI agent platform that enables AI models to perform real-world actions instead of simply generating text responses.
OpenClaw can:
- Execute shell commands
- Analyze system metrics
- Manage files
- Automate workflows
- Connect with external applications
- Integrate with cloud or local AI models
- Operate autonomously through scheduled tasks
Supported AI providers include:
- OpenAI
- Anthropic Claude
- Google Gemini
- Ollama-hosted local models
- Other compatible LLM providers
Unlike traditional AI chat applications, OpenClaw can make decisions and perform actions based on predefined objectives.
Why Use OpenClaw for Proxmox Monitoring?
Traditional monitoring tools excel at detecting problems but offer limited assistance in diagnosing them.
OpenClaw extends monitoring by:
- Detecting abnormal resource utilization
- Logging into the Proxmox host automatically
- Running diagnostic commands
- Gathering system metrics
- Analyzing logs
- Identifying likely root causes
- Generating remediation recommendations
- Delivering detailed reports via email
This transforms monitoring from a simple alerting system into an intelligent troubleshooting assistant.
System Requirements
Before installing OpenClaw, ensure your environment meets the following requirements:
| Component | Requirement |
|---|---|
|
Operating System |
Linux, macOS, Windows |
|
Node.js |
Version 22+ (24 recommended) |
|
Memory |
Minimum 8 GB RAM |
|
Internet Connection |
Required for setup |
|
AI Provider |
OpenAI, Claude, Gemini, Ollama, etc. |
Workflow
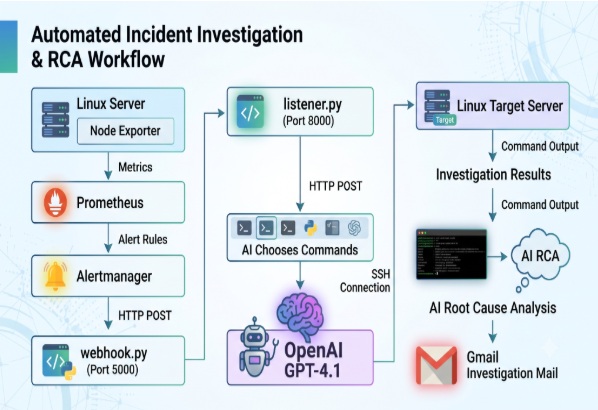
Architecture
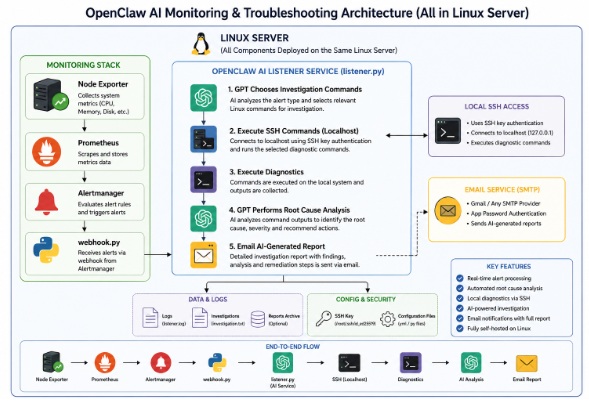
Environment Used
Linux Monitoring Server
IP Address: X.X.1.28
OS: Ubuntu 22.04
Installed:
Install Prometheus
Linux server:
sudo apt updateDownload:
wget https://github.com/prometheus/prometheus/releases/latest/download/prometheus-linux-amd64.tar.gzExtract:
tar -xvf prometheus-linux-amd64.tar.gzVerify the metrics
Verify the metrics
http://X.X.1.28:9090
Install Node Exporter
Verify the metrics
wget
https://github.com/prometheus/node_exporter/releases/latest/download/node_exporter-1.11.1.linux-amd64.tar.gz
Extract:
tar -xvf node_exporter*Run
./node_exporterInstalled
Prometheus
Alertmanager
Node Exporter
Configure Prometheus Alert Rules
Vi /opt/prometheus-3.4.1.linux-amd64/alerts.rules.yml
groups:
- name: openclaw-alerts

  rules:

  - alert: HighCPUUsage
    expr: 100 - (avg by(instance)(rate(node_cpu_seconds_total{mode="idle"}[1m])) * 100) > 80
    for: 1m
    labels:
      severity: critical
    annotations:
      summary: "CPU usage above 80%"

  - alert: HighMemoryUsage
    expr: ((node_memory_MemTotal_bytes - node_memory_MemAvailable_bytes) / node_memory_MemTotal_bytes) * 100 > 80
    for: 1m
    labels:
      severity: warning
    annotations:
      summary: "Memory usage above 80%"

  - alert: HighDiskUsage
    expr: ((node_filesystem_size_bytes{mountpoint="/"} - node_filesystem_free_bytes{mountpoint="/"}) / node_filesystem_size_bytes{mountpoint="/"}) * 100 > 80
    for: 1m
    labels:
      severity: warning
    annotations:
      summary: "Disk usage above 80%"
Add Rule File to Prometheus
Vi /opt/prometheus-3.4.1.linux-amd64/prometheus.yml
global:
  scrape_interval: 15s

rule_files:
  - "rules/*.yml"

scrape_configs:

  - job_name: "openclaw"
    static_configs:
      - targets:
          - localhost:9100

  - job_name: "proxmox"
    static_configs:
      - targets:
          - X.X.1.28:9100

alerting:
  alertmanagers:
    - static_configs:
        - targets:
            - localhost:9093
Configure Alertmanager
Vi /opt/alertmanager-0.32.1.linux-amd64/alertmanager.yml
route:
  group_by: ['alertname']
  group_wait: 30s
  group_interval: 5m
  repeat_interval: 1h
  receiver: openclaw-ai

  routes:
    - receiver: openclaw-ai
    - receiver: email-team

receivers:
  - name: web.hook
    webhook_configs:
      - url: "http://127.0.0.1:5001/"

  - name: openclaw-ai
    webhook_configs:
      - url: "http://127.0.0.1:5000/alert"

  - name: email-team
    email_configs:
      - to: "XXXXXX@gmail.com"
        from: "alert@server.com"
        smarthost: "smtp.gmail.com:587"
        auth_username: "XXXXXX@gmail.com"
        auth_password: "xxxx xxxx xxxx xxxx"
        auth_identity: "XXXXX@gmail.com"
        require_tls: true

inhibit_rules:
  - source_matchers: [severity="critical"]
    target_matchers: [severity="warning"]
    equal: [alertname, instance]
Create the AI Listener Service
sudo mkdir -p /opt/scripts/openclaw-ai
cd /opt/scripts/openclaw-ai
python3 -m venv venv
source venv/bin/activate
pip install flask openai paramiko yagmail requests python-dotenv
Check service logs:
journalctl -u openclaw-listener -f
journalctl -u openclaw-webhook -f
Vi /opt/openclaw-ai/listener.py
root@openclaw:/opt/openclaw-ai# cat listener.py
from flask import Flask, request
from openai import OpenAI
import paramiko
import yagmail
import os


# ==========================================
# CONFIGURATION
# ==========================================


OPENAI_API_KEY = "sk-proj-xxxxxxxxxxxxxxxxxxxxxxxxxxxxxxxxxxxxx"


EMAIL_USER = "xxxxxxxxx@gmail.com"
EMAIL_APP_PASSWORD = "xxxx xxxx xxxx xxx"


SSH_USERNAME = "xxxxxxxxxxxxxx"


SSH_KEY="/root/.ssh/id_ed25519"


client = OpenAI(api_key=OPENAI_API_KEY)


app = Flask(__name__)


# ==========================================
# SSH COMMAND EXECUTION
# ==========================================


def run_command(server, command):


    ssh = paramiko.SSHClient()


    ssh.set_missing_host_key_policy(
        paramiko.AutoAddPolicy()
    )


    ssh.connect(
        hostname=server,
        username=SSH_USERNAME,
        key_filename=SSH_KEY
    )


    stdin, stdout, stderr = ssh.exec_command(command)


    output = stdout.read().decode()
    error = stderr.read().decode()


    ssh.close()


    if error:
        return f"ERROR:\n{error}"


    return output


# ==========================================
# AI DECIDES WHAT TO INVESTIGATE
# ==========================================


def get_investigation_commands(alertname):


    response = client.chat.completions.create(
        model="gpt-4.1",
        messages=[
            {
                "role": "system",
                "content": """


You are an expert Linux Site Reliability Engineer.


A monitoring alert has been triggered.


Your task is to autonomously investigate the incident.


Think exactly like an experienced Linux administrator.


Based on ONLY the alert name,
decide what Linux commands should be executed.


Requirements:


- Decide the investigation commands yourself.
- Do NOT ask for clarification.
- Do NOT explain anything.
- Return ONLY executable Linux commands.
- One command per line.
- Maximum 10 commands.
- Choose commands that help identify the root cause.
- Prefer standard Linux utilities that are commonly available.
- If an advanced utility (such as mpstat, iostat, sar, pidstat, ss, lsof, etc.) is required, use it only if it is likely to exist on the system; otherwise choose an appropriate alternative.
- Avoid destructive commands.
- Avoid commands requiring user interaction.
- Never modify the server.
- Do not install packages.
- Do not assume specific monitoring tools are installed.


Your goal is to collect enough evidence for a root cause analysis.


"""
            },
            {
                "role": "user",
                "content": alertname
            }
        ]
    )


    return response.choices[0].message.content


# ==========================================
# AI DRIVEN INVESTIGATION
# ==========================================


def investigate_server(server, alertname):


    commands_text = get_investigation_commands(
        alertname
    )


    print()
    print("=" * 50)
    print("AI SELECTED COMMANDS")
    print("=" * 50)
    print(commands_text)


    report = ""


    commands = commands_text.splitlines()


    for cmd in commands:


        cmd = cmd.strip()


        if not cmd:
            continue


        try:


            print(f"Running: {cmd}")


            output = run_command(
                server,
                cmd
            )


            report += f"\n\n===== {cmd} =====\n"
            report += output


        except Exception as e:


            report += f"\n\n===== {cmd} =====\n"
            report += f"ERROR: {str(e)}"


    return report


# ==========================================
# ROOT CAUSE ANALYSIS
# ==========================================


def analyze_report(report):


    response = client.chat.completions.create(
        model="gpt-4.1",
        messages=[
            {
                "role": "system",
                "content": """
You are a Senior Linux SRE.


Analyze the investigation report.


Provide:


1. Root Cause
2. Problematic Process
3. Severity
4. Suggested Commands
5. Recommended Action


Be detailed and practical.
"""
            },
            {
                "role": "user",
                "content": report
            }
        ]
    )


    return response.choices[0].message.content


# ==========================================
# EMAIL REPORT
# ==========================================


def send_email(server, alertname, report, analysis):


    print("========== ENTERED send_email() ==========")


    import smtplib
    from email.mime.multipart import MIMEMultipart
    from email.mime.text import MIMEText


    print("Creating MIME message...")


    msg = MIMEMultipart()


    msg["From"] = EMAIL_USER
    msg["To"] = EMAIL_USER
    msg["Subject"] = f"OpenClaw Alert - {alertname}"


    print("Building HTML...")


    html = f"""
<html>
<body>
<pre>
Server: {server}


Alert: {alertname}


{report}


{analysis}
</pre>
</body>
</html>
"""


    msg.attach(MIMEText(html, "html"))


    print("Connecting to Gmail SMTP...")


    smtp = smtplib.SMTP("smtp.gmail.com", 587)


    print("Starting TLS...")


    smtp.starttls()


    print("Logging in...")


    smtp.login(EMAIL_USER, EMAIL_APP_PASSWORD)


    print("Sending mail...")


    smtp.sendmail(
        EMAIL_USER,
        EMAIL_USER,
        msg.as_string()
    )


    print("Mail sent!")


    smtp.quit()


# ==========================================
# ALERT ENDPOINT
# ==========================================


@app.route("/analyze", methods=["POST"])
def analyze():


    data = request.json


    server = data.get("server", "").split(":")[0]


    print(f"SSH Server: {server}")


    alertname = data.get(
        "alertname",
        "UnknownAlert"
    )


    print()
    print("=" * 50)
    print("PROMETHEUS ALERT RECEIVED")
    print("=" * 50)


    print(f"SERVER : {server}")
    print(f"ALERT  : {alertname}")


    print()
    print("Starting autonomous investigation...")


    report = investigate_server(
        server,
        alertname
    )


    with open(
        "investigation.txt",
        "w",
        encoding="utf-8"
    ) as f:
        f.write(report)


    print("Investigation completed")


    print()
    print("Analyzing with AI...")


    analysis = analyze_report(report)


    with open("analysis.txt", "w", encoding="utf-8") as f:
       f.write(analysis)


    print()
    print("=" * 50)
    print("AI ANALYSIS")
    print("=" * 50)


    print(analysis)


    try:


        send_email(
            server,
            alertname,
            report,
            analysis
        )


        print()
        print("Email sent successfully")


    except Exception as e:


        print()
        print("Email failed")
        print(str(e))


    return {
        "status": "received"
    }


# ==========================================
# START FLASK
# ==========================================


if __name__ == "__main__":


    app.run(
        host="0.0.0.0",
        port=8000
    )
Install Python packages for the webhook:
cd /opt/openclaw-alerts
python3 -m venv venv
source venv/bin/activate
pip install flask requests
Configure Gmail App Password
- Open your Google Account security settings.
- Enable 2-Step Verification if it is not already enabled.
- Create an App Password for Mail.
- Copy the generated 16-character password.
- Paste it into /opt/scripts/openclaw-ai/.env as EMAIL_APP_PASSWORD.
Configure SSH Key Authentication
Generate an SSH key on the AI listener server:
sudo ssh-keygen -t ed25519 -f /root/.ssh/id_ed25519 -N ""Copy the public key to the monitored server:
sudo ssh-copy-id -i /root/.ssh/id_ed25519.pub root@xx.x.x.xxVerify SSH connectivity:
sudo ssh -i /root/.ssh/id_ed25519 root@xx.x.x.xx hostnameCreate systemd Services
Create the AI listener service:
sudo vi /etc/systemd/system/openclaw-listener.service
[Unit]
Description=OpenClaw AI Listener Service
After=network.target


[Service]
Type=simple
WorkingDirectory=/opt/scripts/openclaw-ai
ExecStart=/opt/scripts/openclaw-ai/venv/bin/python /opt/scripts/openclaw-ai/listener.py
Restart=always
RestartSec=5
User=root


[Install]
WantedBy=multi-user.target
Vi /opt/openclaw-alerts/weebhook.py
from flask import Flask, request
import requests
import json


app = Flask(__name__)


# Change this if your listener runs on another IP/port
LISTENER_URL = "http://127.0.0.1:8000/analyze"


@app.route("/alert", methods=["POST"])
def alert():


    data = request.json


    print("=" * 60)
    print("ALERT RECEIVED FROM ALERTMANAGER")
    print("=" * 60)


    print(json.dumps(data, indent=2))


    if not data.get("alerts"):
        return {"status": "No alerts received"}, 400


    alert = data["alerts"][0]


    payload = {
        "server": alert["labels"].get("instance"),
        "alertname": alert["labels"].get("alertname"),
        "severity": alert["labels"].get("severity", "warning")
    }


    print()
    print("=" * 60)
    print("FORWARDING ALERT TO OPENCLAW AI")
    print("=" * 60)
    print(json.dumps(payload, indent=2))


    try:


        response = requests.post(
            LISTENER_URL,
            json=payload,
            timeout=300
        )


        print()
        print("Listener Response :", response.status_code)
        print(response.text)


        return {
            "status": "forwarded",
            "listener_status": response.status_code
        }, 200


    except Exception as e:


        print()
        print("ERROR forwarding to OpenClaw")
        print(str(e))


        return {
            "status": "failed",
            "error": str(e)
        }, 500


if __name__ == "__main__":


    app.run(
        host="0.0.0.0",
        port=5000
    )
Create the webhook service:
sudo vi /etc/systemd/system/openclaw-webhook.service
[Unit]
Description=OpenClaw Alertmanager Webhook Service
After=network.target


[Service]
Type=simple
WorkingDirectory=/opt/openclaw-alerts
ExecStart=/opt/openclaw-alerts/venv/bin/python /opt/openclaw-alerts/webhook.py
Restart=always
RestartSec=5
User=root


[Install]
WantedBy=multi-user.target
Reload systemd and start both services:
sudo systemctl daemon-reload
sudo systemctl enable openclaw-listener openclaw-webhook
sudo systemctl start openclaw-listener openclaw-webhook
sudo systemctl status openclaw-listener
sudo systemctl status openclaw-webhook
Test commands to give stress and check
CPU
Stress --cpu 8 --timeout 300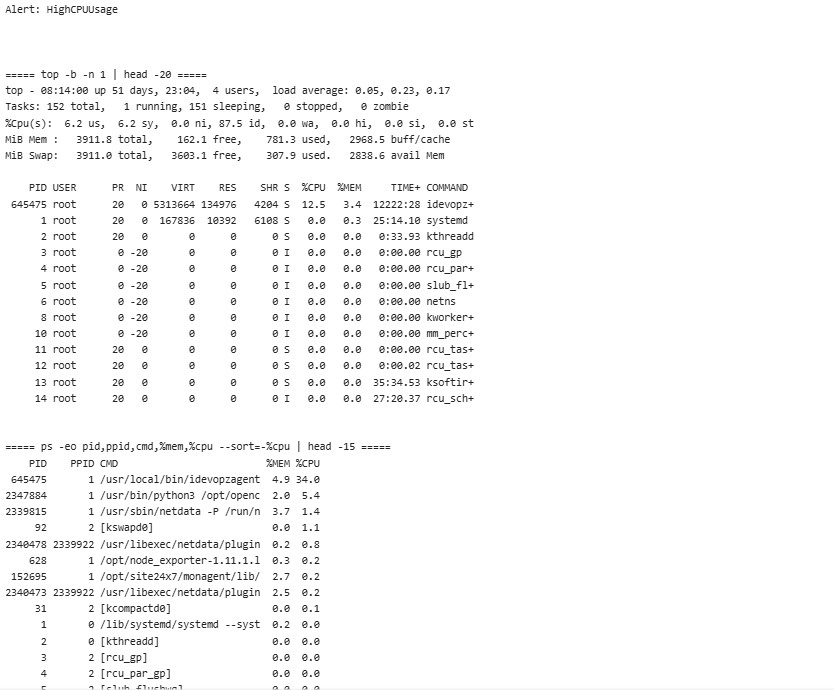
Root Cause Analysis
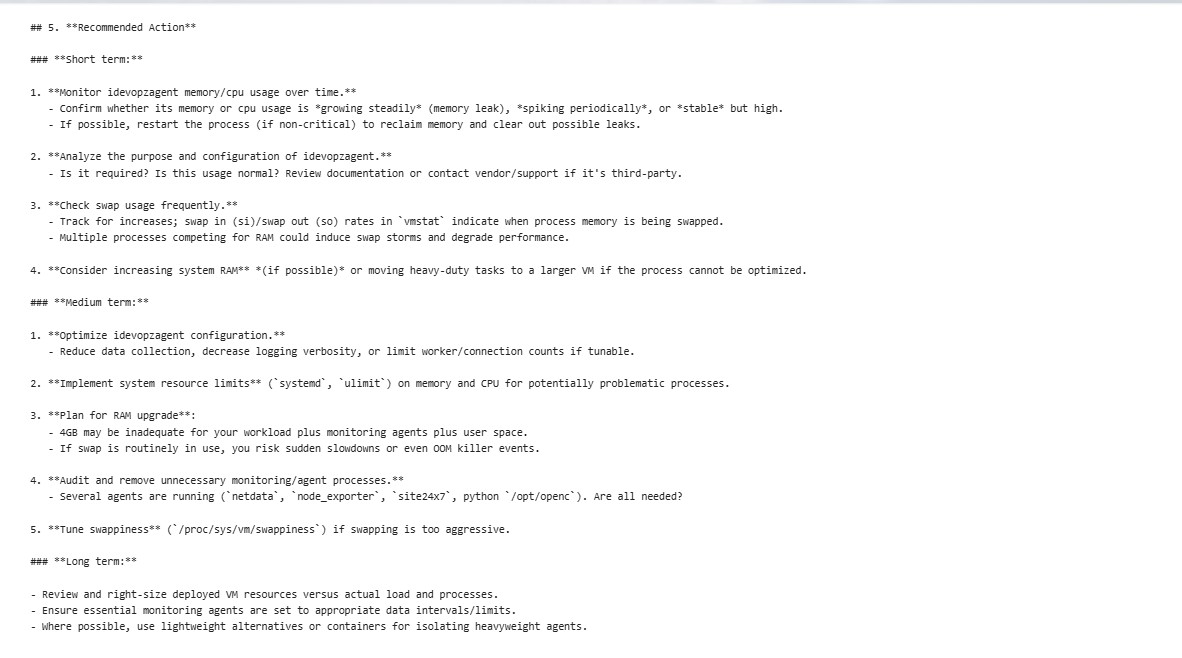
Memory
stress --vm 3 --vm-bytes 1200M --timeout 300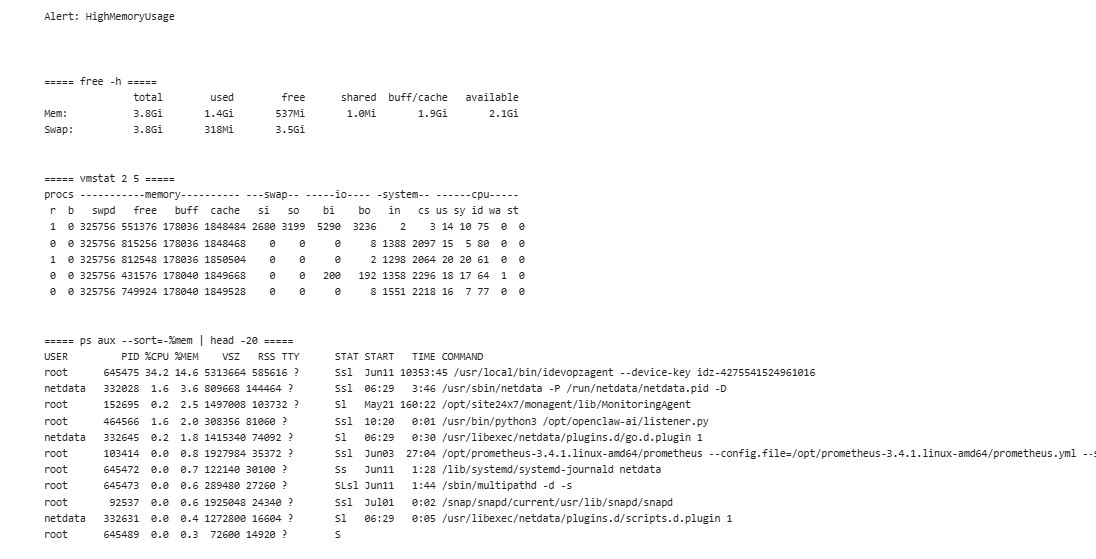
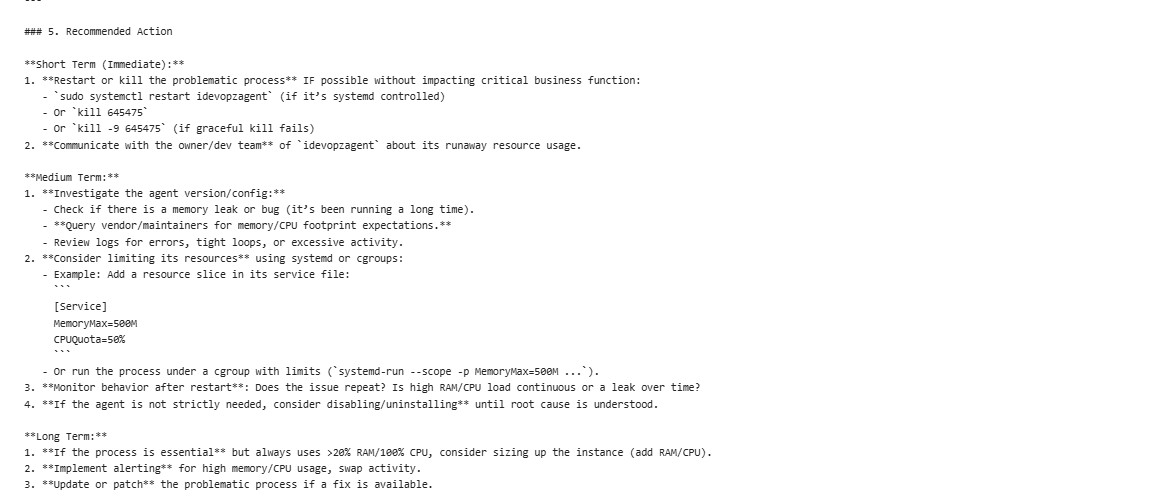
Root CAuse Analysis
Disk
fallocate -l 8G /tmp/diskstress.img

Then check

 df -h

After you receive the alert

Delete the file:

rm -f /tmp/diskstress.img

Then check:

df -h
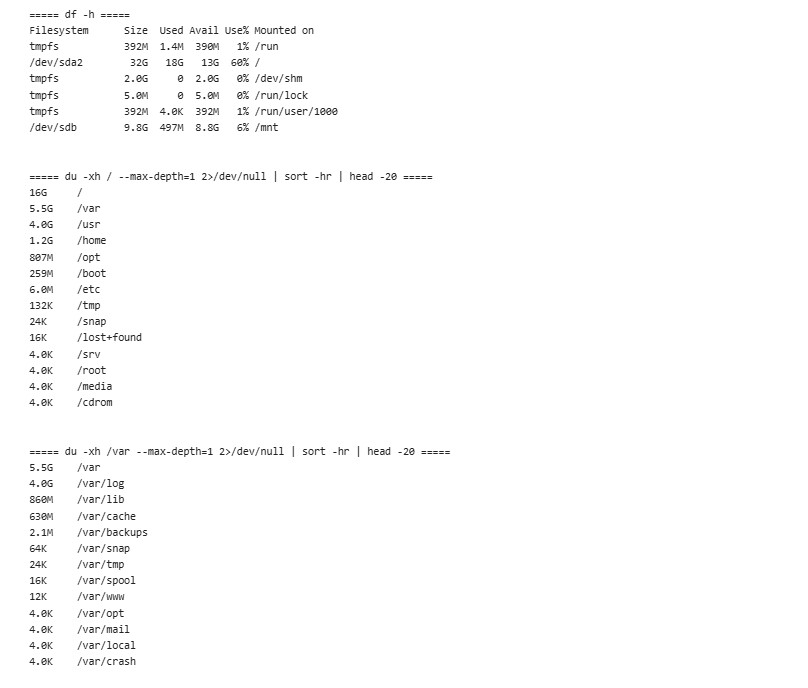
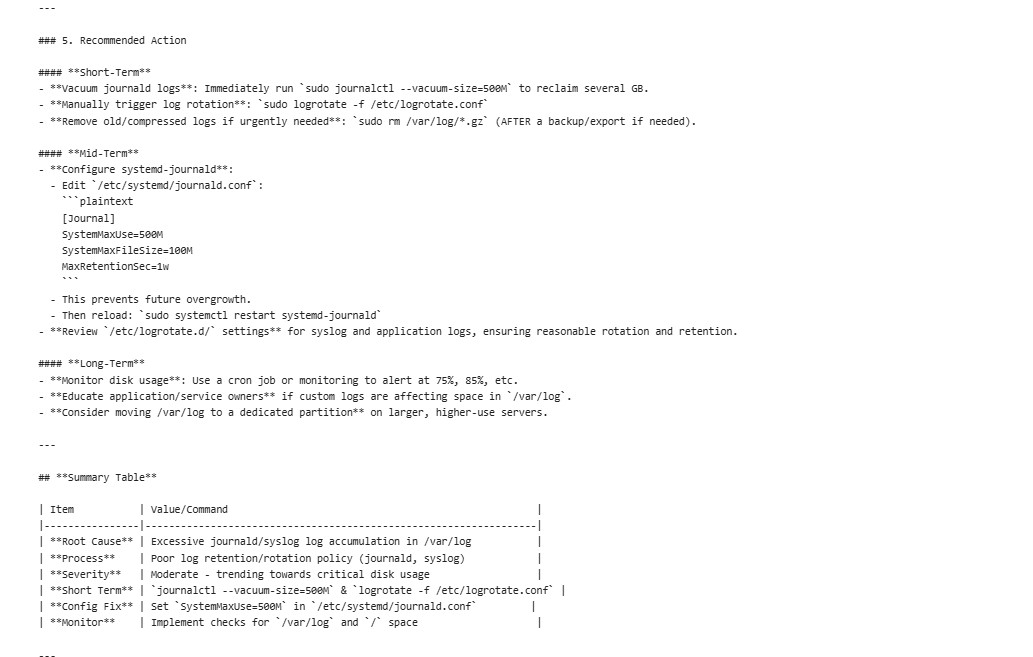
Root Cause Analysis
Conclusion
This solution transforms traditional monitoring into an AI-driven workflow that automatically detects, investigates, and analyzes infrastructure issues, enabling faster troubleshooting and more efficient server management.