Introduction:
Prometheus Alertmanager is a crucial component in the Prometheus monitoring ecosystem, responsible for handling alerts generated by the Prometheus server. In this blog post, we’ll dive into the key aspects of Alertmanager, its role in managing alerts, and how it contributes to effective incident response.
Key Features:
Alert Grouping:
- Alertmanager intelligently groups similar alerts, preventing alert fatigue and providing a more streamlined view for operators.
Silencing Alerts:
- Operators can silence specific alerts temporarily, allowing for scheduled maintenance or when certain alerts are expected and don’t require immediate attention.
Notification Routing:
- The tool supports flexible notification routing, enabling alerts to be sent to appropriate channels or recipients based on predefined configurations.
Integration with Prometheus:
- Seamless integration with Prometheus allows Alertmanager to receive alerts and execute actions based on the defined rules and configurations.
Configurations:
Alert Routing:
- Explore how to set up routing trees to direct alerts to the right team or individual based on severity or type.
Inhibition Rules:
- Learn about inhibition rules and how they prevent unnecessary alerts by suppressing dependent alerts when a higher-level alert is triggered.
Notification Templates:
- Customise alert notifications with templates, allowing operators to receive informative and actionable alerts.
Best Practices:
Effective Labeling:
- Utilise Prometheus labels effectively to enhance alert grouping and ensure alerts are directed to the right teams.
Silence Rules:
- Implement silence rules judiciously, understanding when to use them and when they might impact incident response negatively.
Testing Configurations:
- Develop a testing strategy for Alertmanager configurations to ensure that changes won’t lead to unexpected behaviours during critical incidents.
Real-world Use Cases:
- Provide examples of how organizations leverage Prometheus Alertmanager in their production environments, solving real-world challenges and improving incident resolution times.
I. Prometheus Alertmanager Installation
(i) Download Alertmanager:
Start by downloading the latest version of Prometheus Alertmanager from the official releases page.
https://github.com/prometheus/alertmanager
$ wget
$ tar -xvf alertmanager-0.26.0.linux-amd64.tar.gz
$ cd alertmanager-0.26.0.linux-amd64
(iii) Setup Alert Manager Systemd Service
Create a user and group for the Alert Manager to allow permission only for the specific user.
$ groupadd -f alertmanager
$ useradd -g alertmanager - no-create-home - shell /bin/false alertmanager
Creating directories is /etc to store the configuration and library files and change the ownership of the directory only for the specific user.
$ mkdir -p /etc/alertmanager/templates
$ mkdir /etc/alertmanager
$ chown alertmanager:alertmanager /etc/alertmanager
$ chown alertmanager:alertmanager /etc/alertmanager
Copy the alertmanager and amtol [a syntax checker utility] files in the /usr/bin directory and change the group and owner to alertmanager. As well as copy the configuration file alertmanager.yml to the /etc directory and change the owner and group name to alertmanager.
$ cp alertmanager /usr/bin/
$ cp amtool /usr/bin/
$ chown alertmanager:alertmanager /usr/bin/alertmanager
$ chown alertmanager:alertmanager /usr/bin/amtool
$ cp alertmanager.yml /etc/alertmanager/alertmanager.yml
$ chown alertmanager:alertmanager /etc/alertmanager/alertmanager.yml
(iv) Run Alertmanager:
Launch Alertmanager with the configured file:
./alertmanager --config.file=alertmanager.yml
Create a service file in /etc/systemd/system and the file name is alertmanager.service.
[Unit]
Description=AlertManager
Wants=network-online.target
After=network-online.target
[Service]
User=alertmanager
Group=alertmanager
Type=simple
ExecStart=/usr/bin/alertmanager
- config.file /etc/alertmanager/alertmanager.yml
- storage.path/etc/alertmanager/
[Install]
WantedBy=multi-user.target
After providing the necessary permission to the file reload the background processes and start the Alert Manager service. To prevent the manual restart of the service after reboot, enable the service.
systemctl daemon-reload
systemctl start alertmanager.service
systemctl enable alertmanager.service
(v) To access the Prometheus Alert Manager dashboard over the browser, use the below url and replace the with the vm ip on which alertmanager was installed.
http://<alertmanager-ip>:9093
II. Create Prometheus Rules
Prometheus rules are essential to trigger alerts. Based on the rules, Prometheus will detect and trigger an alert to the Alert Manager.
Below are some basic alert rules,
$ vim /etc/prometheus/alert-rules.yml

groups:
- name: alert_rules
  rules:
  - alert: InstanceDown
    expr: up == 0
    for: 30s
    labels:
      severity: page
    annotations:
      summary: "Instance {{ $labels.instance }} down"
      description: "{{ $labels.instance }} of job {{ $labels.job }} has been down for more than 30 seconds."

  - alert: HostOutOfMemory
    expr: (node_memory_MemAvailable_bytes / node_memory_MemTotal_bytes * 100 < 10) * on(instance) group_left (nodename) node_uname_info{nodename=~".+"}
    for: 10s
    labels:
      severity: warning
    annotations:
      summary: Host out of memory (instance {{ $labels.instance }})
      description: "Node memory is filling up (< 10% left)n  VALUE = {{ $value }}n  LABELS = {{ $labels }}"
  - alert: HostHighCpuLoad
    expr: (sum by (instance) (avg by (mode, instance) (rate(node_cpu_seconds_total{mode!="idle"}[2m]))) > 0.8) * on(instance) group_left (nodename) node_uname_info{nodename=~".+"}
    for: 5m
    labels:
      severity: warning
    annotations:
      summary: Host high CPU load (instance {{ $labels.instance }})
      description: "CPU load is > 80%n  VALUE = {{ $value }}n  LABELS = {{ $labels }}"
  - alert: Jenkins_Service_Down
    expr: node_systemd_unit_state{name="jenkins.service",state="active"} == 0
    for: 1s
    annotations:
      summary: "Instance {{ $labels.instance }} is down"
      description: "{{ $labels.instance }} of job {{ $labels.job }} is down."
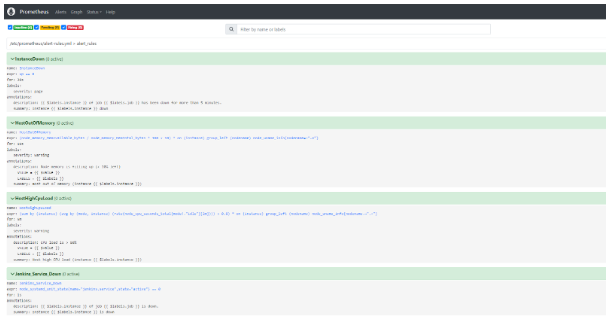
Once the alert rule is added, restart the prometheus.service. The alert rule will appear in the Prometheus console, as shown below.
Create a new email template file and add the following to email.tmp
sudo vi /etc/alertmanager/templates/email.tmpl
{{ define "email" }}
<html>
   <head>
      <style type="text/css">
         table {
         font-family: verdana,arial,sans-serif;
         font-size:11px;
         color:#333333;
         border-width: 1px;
         border-color: #999999;
         border-collapse: collapse;
         }
         table th {
         background-color:#ff6961;
         border-width: 1px;
         padding: 8px;
         border-style: solid;
         border-color: #F54C44;
         }
         table td {
         border-width: 1px;
         padding: 8px;
         border-style: solid;
         border-color: #F54C44;
         text-align: right;
         }
      </style>
   </head>
   <body>
      <table border=1>
         <thead>
           <tr>
        <th>Alert name</th>
        <th>Host</th>
            <th>Summary</th>
            <th>Description</th>
           </tr>
         </thead>

         <tbody>
       {{ range .Alerts }}
            <tr>
         <td>{{ .Labels.alertname }}</td>
         <td>{{ .Annotations.host }}</td>
         <td>{{ .Annotations.summary }}</td>
         <td>{{ .Annotations.description }}</td>
           </tr>
          {{ end }}
         </tbody>

      </table>
  </body>
</html>

{{end}}
Add the following to the alertmanager.yml file. In this configuration, I have used the AWS SES SMTP credentials to send email alerts.
global:
  #  smtp_smarthost: 'email-smtp.eu-north-1.amazonaws.com:587'
  #  smtp_from: 'xxxxxxx@xxxxxxxxxx.com'
  smtp_require_tls: true
  smtp_hello: 'alertmanager'
    #  smtp_auth_username: 'AXXXXXXXXXXXN'
    #  smtp_auth_password: 'BXXXXXXXXXXXXXXXXh'

route:
  group_by: ['instance', 'alert']
  group_wait: 30s
  group_interval: 5m
  repeat_interval: 10m
  receiver: devops-team

receivers:
  - name: 'devops-team'
    email_configs:
      - to: 'xxxxxxxxx@xxxxxxxxxxx.in'
        smarthost: 'email-smtp.eu-north-1.amazonaws.com:587'
        from: 'xxxxxxxxxxx@xxxxxxxxxxx.in'
        auth_username: 'AXXXXXXXXXXXXXXXXXXN'
        auth_password: 'BXXXXXXXXXXXXXXXXXXXXXXXXh'
        html: '{{ template "email" .}}'
        headers:
          subject: "[ AlertManager ] {{ .CommonLabels.severity }} Alert: {{ .CommonLabels.alertname }}"
          #html: '{{ template "custom_mail_html" . }}'
templates:
  - '/etc/alertmanager/templates/email.tmpl'
Restart the alertmanager service.
Note:
Let’s know what does the below config stands for,
- group_by: [‘instance’, ‘alert’] This line specifies the labels by which alerts should be grouped. In this case, alerts will be grouped based on the ‘instance’ label (which typically refers to the target/service being monitored) and the ‘alert’ label (which represents the type of alert).
- group_wait: 30s This indicates the time period during which alerts with the same group key (defined by ‘group_by’) are collected before being dispatched. In this case, alerts with the same ‘instance’ and ‘alert’ labels will be collected for 30 seconds before being routed.
- group_interval: 5m After an initial group of alerts has been sent out, alertmanager will wait for this duration before sending out additional alerts of the same group. This helps prevent excessive notifications for the same issue. In this case, it waits for 5 minutes before sending out alerts again.
- repeat_interval: 10m This specifies how often Alertmanager should resend notifications for an unresolved alert. If an alert remains unresolved after being sent out, alertmanager will resend notifications for it at this interval. Here, it’s set to 10 minutes.
- receiver: devops-team: This indicates the name of the receiver to which the grouped and processed alerts will be sent. In this case, alerts will be sent to a receiver named ‘devops-team’.
II. Prometheus Configuration
Ensure Prometheus Setup:
Make sure your Prometheus is correctly configured to scrape targets and has relevant alerting rules. Refer to the Prometheus Configuration (Refers to Prometheus Installation Guide – Gokul document ) guide for detailed instructions.
Modify Prometheus Configurations
Navigate to the Prometheus configuration file, which is in the /etc/prometheus directory.
$ vim /etc/prometheus/prometheus.yml
Add the following to the alertmanager.yml file. In this configuration, I have used the AWS SES SMTP credentials to send email alerts.
global:
 scrape_interval: 15s
 evaluation_interval: 15s

# Alertmanager configuration
alerting:
 alertmanagers:
   - static_configs:
       - targets:
          - <alertmanager_ip>:9093

rule_files:
 - "alert-rules.yml"

scrape_configs:
 - job_name: "prometheus"
   static_configs:
     - targets: ["localhost:9090"]

 - job_name: "node_exporter"
   scrape_interval: 5s
   static_configs:
     - targets: ['127.0.0.1:9100']
In the rule_files section, provide the path of the Prometheus rules files also ensure the rules files are in the same directory where the Prometheus configuration file is in or give the proper path.
scrape_configs section will have the server information that you want to monitor, the target field contains the IP address of the target server.
After modifying the configurations, restart the Prometheus service using the following command.
$ systemctl restart prometheus.service
Grafana Integration [ Custom Dashboard for AlertManager ]
( i ) Install Grafana following the instructions on the official installation page.
Configure Prometheus Data Source:
- Open Grafana, go to settings, and navigate to “Data Sources.”
- Add a new Prometheus data source, specifying the URL (e.g., http://localhost:9090).
Import Prometheus Dashboard:
- Grafana provides pre-built dashboards. Import one by navigating to the “+” icon and selecting “Import.”
- Use the Grafana Dashboard ID for Prometheus (commonly 1860).
Set Up Alerting in Grafana:
- Access the dashboard settings, select the “Alert” tab, and add a new alert based on your requirements.
Configure Notifications:
- Configure notification channels such as email or Slack in Grafana to receive alerts. Explore the Grafana Alerting documentation for details.
( ii ) Prometheus Alertmanager Integration with Grafana
Update Prometheus Configuration:
- Include the Alertmanager URL in the Prometheus configuration.
- Example YAML snippet:
alerting:
  alertmanagers:
  - static_configs:
    - targets:
      - "alertmanager:9093"
( iii ) Restart Prometheus:
- Restart Prometheus to apply the changes.
Conclusion:
Sum up the importance of Prometheus Alertmanager in maintaining a robust monitoring and alerting system. Encourage readers to explore further, experiment with configurations, and tailor Alertmanager to suit their specific operational needs.
By the end of the blog, readers should have a solid understanding of Prometheus Alertmanager’s capabilities, configurations, and best practices for efficient alert management.
Are you interested in finding out how we achieved this?
Contact us @info@idevopz.com
Website: https://www.idevopz.com/