
Introduction
Prometheus and Grafana stand as formidable pillars in the realm of open-source tools, wielding immense power in monitoring and visualizing system metrics. Their integration has become indispensable, constituting the backbone of physical and cloud infrastructures. Meanwhile, Node Exporter serves as the diligent collector of Linux system metrics, meticulously capturing data on CPU load, memory usage, network activity, and disk I/O. The AlertManager adds another layer of functionality, empowering users to craft personalised alerts seamlessly integrated with Prometheus.
Through this comprehensive tutorial, readers will gain not only the technical know-how but also the practical insights necessary to optimize their monitoring and visualization capabilities. This complete tutorial has been carried out in AWS Cloud. Join us as we unlock the potential of these tools, ushering in a new era of efficiency and reliability in infrastructure management.
We will be using two servers: Server A and Server B. Server A will act as the Prometheus server, where we’ll set up Prometheus, Grafana, and Node Exporter. On the other hand, we’ll install the Node Exporter on Server B. We’ll then proceed to integrate Server B’s metrics to the Prometheus server and visualize them on Grafana.
Pre-requisite:
- A VM with Ubuntu 20.04 LTS OS.
A minimum of 2GB of RAM and 1 vCPU is required.
What will we do in this installation?
- Install and configure Prometheus.
- Install and configure Node Exporter.
- Install and configure and Integrate Grafana with Prometheus
Note:
For installation of Alertmanager & custom Grafana dashboard kindly refer to this blog < Topic: Setting Up Alertmanager and Custom Grafana dashboard for Monitoring >
STEP 1. Prometheus Installation and Setup (1)
Execute the following command to install Prometheus.
wget https://github.com/prometheus/prometheus/releases/download/v2.50.1/prometheus-2.50.1.linux-amd64.tar.gz  (We check the official Prometheus site and get the latest download link for the Linux binary https://prometheus.io/download/ )

tar -xvf prometheus-2.50.1.linux-amd64.tar.gz

sudo useradd --no-create-home --shell /bin/false prometheus

sudo mkdir /etc/prometheus

sudo mkdir /var/lib/prometheus

sudo chown prometheus:prometheus /etc/prometheus

sudo chown prometheus:prometheus /var/lib/prometheus

sudo cp prometheus-2.50.1.linux-amd64/prometheus /usr/local/bin/

sudo cp prometheus-2.50.1.linux-amd64/promtool /usr/local/bin/

sudo chown prometheus:prometheus /usr/local/bin/prometheus

sudo chown prometheus:prometheus /usr/local/bin/promtool

sudo cp -r prometheus-2.50.1.linux-amd64/consoles /etc/prometheus

sudo cp -r prometheus-2.50.1.linux-amd64/console_libraries /etc/prometheus

sudo chown -R prometheus:prometheus /etc/prometheus/consoles

sudo chown -R prometheus:prometheus /etc/prometheus/console_libraries
(2) Create the prometheus.yml file for the Prometheus configuration.
sudo vi /etc/prometheus/prometheus.yml(3) Add the following to the prometheus.yml file.
global:
  scrape_interval: 10s
  evaluation_interval: 15s

rule_files:
  - alert-rules.yml

scrape_configs:
  - job_name: 'Server A'
    static_configs:
      - targets: ['localhost:9090']
Note:
Let’s break down the prometheus.yml for better understanding,
- The global section controls the Prometheus server’s global configuration.
- scrape_interval, is the action of collecting metrics through an HTTP request from a targeted instance, parsing the response, and ingesting the collected samples to storage
- evaluation_interval, controls how often Prometheus will keep evaluating alert rules.
- The rule_files block specifies the location of any rules we want the Prometheus server to load.
- The last section, scrape_configs, controls what resources Prometheus needs tp monitor.
(4) Change the file ownership to Prometheus user.
sudo chown prometheus:prometheus /etc/prometheus/prometheus.yml(5) Create a Prometheus service file.
sudo vi /etc/systemd/system/prometheus.service(6) Add the following configuration to the prometheus.service file
[Unit]
Description=Prometheus
Wants=network-online.target
After=network-online.target

[Service]
User=prometheus
Group=prometheus
Type=simple
ExecStart=/usr/local/bin/prometheus \
    --config.file /etc/prometheus/prometheus.yml \
    --storage.tsdb.path /var/lib/prometheus/ \
    --web.console.templates=/etc/prometheus/consoles \
    --web.console.libraries=/etc/prometheus/console_libraries

[Install]
WantedBy=multi-user.target
(7) Reload the systemd service to register the Prometheus service. Start the Prometheus service and check its status.
systemctl daemon-reload
systemctl start prometheus.service
systemctl status prometheus.service
(8) You can now access the Prometheus UI through the 9090 port of the Prometheus server.
http://<prometheusip>:9090/graph
STEP 2: Node Exporter Installation and Target Configuration
(1) Execute the following command to install Node exporter installation.
wget https://github.com/prometheus/node_exporter/releases/download/v1.7.0/node_exporter-1.7.0.linux-amd64.tar.gz

tar -xvf node_exporter-1.7.0.linux-amd64.tar.gz

sudo mv node_exporter-1.7.0.linux-amd64/node_exporter /usr/local/bin/

sudo useradd --system --no-create-home --shell /bin/false node_exporter
(2) Create a node_exporter.service file.
sudo vi /etc/systemd/system/node_exporter.service(3) Add the following to the node_exporter.service file
[Install]
WantedBy=multi-user.target
[Unit]
Description=Node Exporter
After=network.target

[Service]
User=node_exporter
Group=node_exporter
Type=simple
ExecStart=/usr/local/bin/node_exporter

[Install]
WantedBy=multi-user.target
(4) Reload the systemd service to register the node_exporter service. Start the node_exporter service and check its status.
systemctl daemon-reload
systemct start node_exporter.service
systemctl status node_exporter.service
(6) We need to add the Node Exporter target (Server B) to the scrape configuration section of the Prometheus configuration file on Server A (/etc/prometheus/prometheus.yml).
global:
  scrape_interval: 10s
  evaluation_interval: 15s

rule_files:
  - alert-rules.yml

scrape_configs:
  - job_name: 'Server A'
    scrape_interval: 5s
    static_configs:
      - targets: ['localhost:9090']

  - job_name: 'Server B'
    scrape_interval: 5s
    static_configs:
      - targets: ['<server B IP Address>']
Let’s break down the prometheus.yml for better understanding,
- In scrape_config first section, we added the Prometheus server as a target so that Prometheus by itself comes under monitoring.
- In the scrape_config second section, we start including the Node Exporter installed in target servers say, “Server B”, i.e. targets are nothing but your client machine.
- We can replace the job-name with the client machine name in place of “Server B”.
- We should use the IP address of the client machine in the targets section.
(7) Restart the Prometheus service and check the target in Prometheus Web
http://<prometheus-IP>:9090/status/Targets) 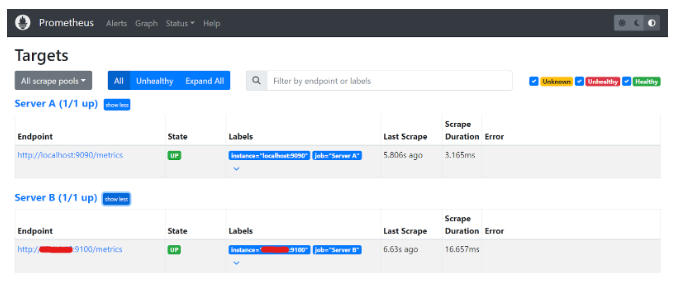
3. Grafana Installation and Integration with Prometheus
(1) Execute the following command to install Grafana.
sudo apt-get install -y adduser libfontconfig1 musl

wget https://dl.grafana.com/enterprise/release/grafana-enterprise_10.3.3_amd64.deb

sudo dpkg -i grafana-enterprise_10.3.3_amd64.deb

sudo systemctl start grafana-server

sudo systemctl status grafana-server
(2) Access grafana UI via port 3000.
http://<grafana_IP>:3000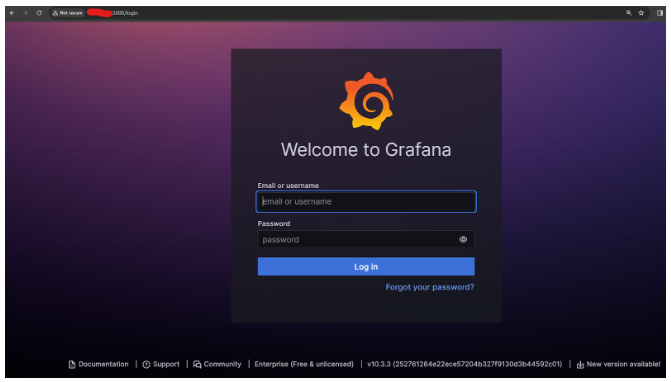
Note: The default username and password is admin.
(3) Click the “ Add your first data source” option from the Grafana homepage and then add the prometheus database.
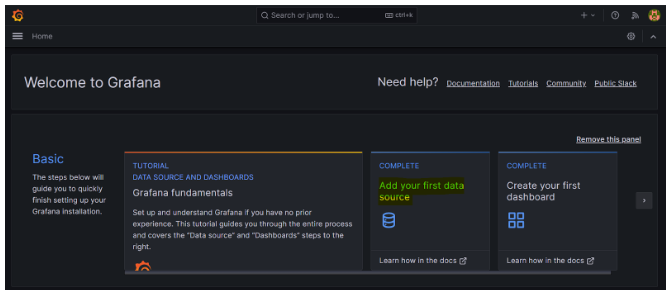

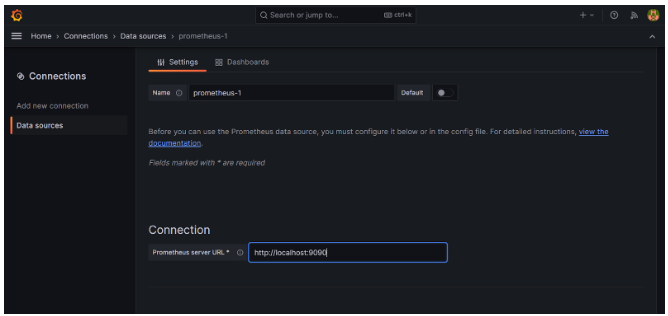
(4) Provide a name for the data source and prometheus server URL http://localhost:9090, then save it.
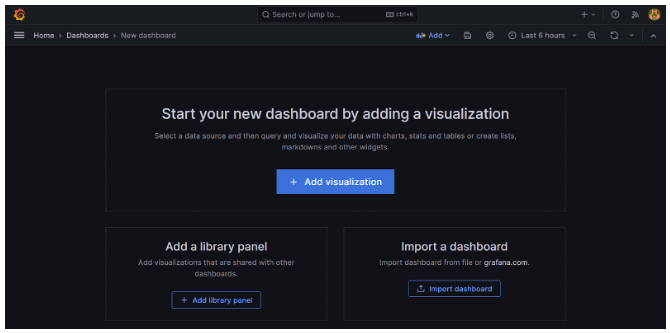
(5) Create New Dashboard -Click Create your first dashboard

(6) Click on Import a dashboard
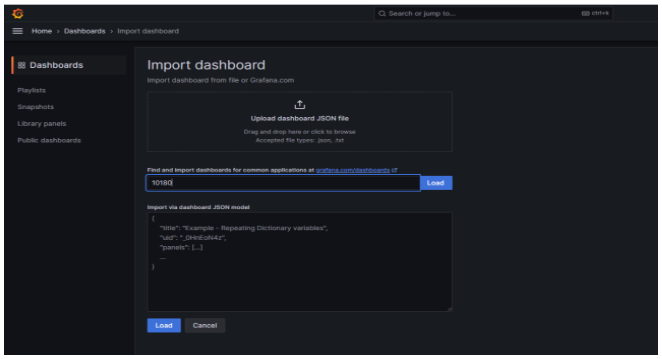
(7) Provide the dashboard ID and click the Load. ( Linux Hosts Metrics | Base dashboard (dashboard id – 10180)), then provide the data source.
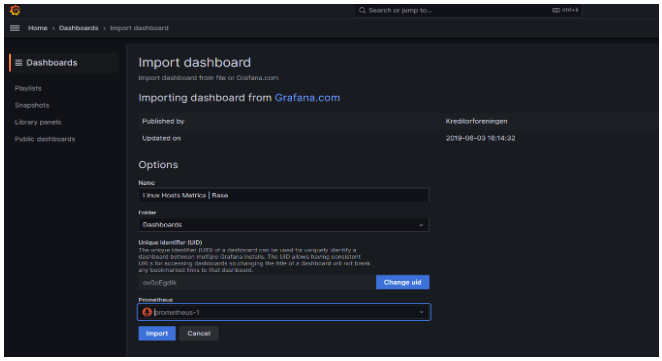
Once imported, we can see the metrics for the target server.
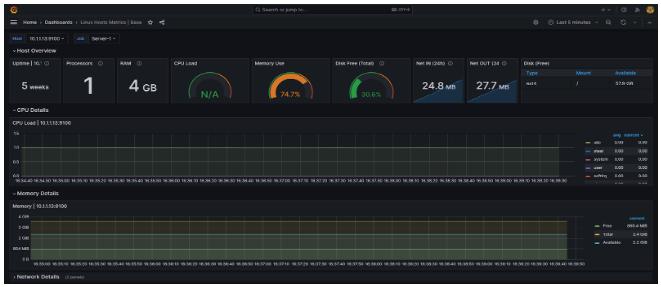
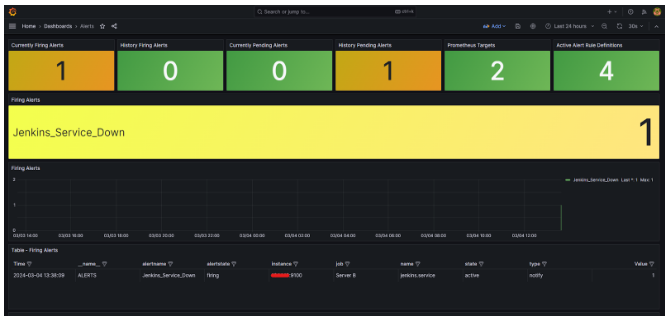
(8) Likewise, to view the dashboard for alerts, try using this ID 162420 and create a new dashboard as previously outlined in this blog and it would look similar to the image below,
Conclusion
Prometheus, AlertManager, and Grafana collectively form a potent trio revolutionizing system monitoring and visualization in modern infrastructures. Prometheus, with its robust data collection capabilities, serves as the backbone, meticulously gathering system metrics. AlertManager enhances operational efficiency by facilitating the creation of customized alerts, ensuring timely responses to critical events. Meanwhile, Grafana’s intuitive visualization tools empower users to glean actionable insights from the amassed data, driving informed decision-making. Together, these tools not only provide a comprehensive view of system health but also enable proactive management, ushering in a new era of efficiency, reliability, and scalability in infrastructure monitoring and management.
Are you interested in finding ways to decrease your workload while improving the efficiency of monitoring your environment’s performance?
Contact us @info@idevopz.com
Website: https://www.idevopz.com/
References:
- Installation:
https://prometheus.io/docs/prometheus/latest/getting_started/
- Configuration & Alert Rule:
https://prometheus.io/docs/prometheus/latest/configuration/configuration/
- Grafana installation:
https://grafana.com/docs/grafana/latest/setup-grafana/installation/debian/

