
Cloud Technologist | Architecting Innovative Solutions for Digital Transformation | AWS, Azure, GCP Expert | Passionate about Emerging Technologies

Introduction
Prometheus Alertmanager is a crucial component in the Prometheus monitoring ecosystem, responsible for handling alerts generated by the Prometheus server. In this blog post, we’ll dive into the key aspects of Alertmanager, its role in managing alerts, and how it contributes to effective incident response.
Key Features:
Alert Grouping:
- Alertmanager intelligently groups similar alerts, preventing alert fatigue and providing a more streamlined view for operators.
Silencing Alerts:
- Operators can silence specific alerts temporarily, allowing for scheduled maintenance or when certain alerts are expected and don’t require immediate attention.
Notification Routing:
- The tool supports flexible notification routing, enabling alerts to be sent to appropriate channels or recipients based on predefined configurations.
Integration with Prometheus:
- Seamless integration with Prometheus allows Alertmanager to receive alerts and execute actions based on the defined rules and configurations.
Configurations:
Alert Routing:
- Explore how to set up routing trees to direct alerts to the right team or individual based on severity or type.
Inhibition Rules:
- Learn about inhibition rules and how they prevent unnecessary alerts by suppressing dependent alerts when a higher-level alert is triggered.
Notification Templates:
- Customise alert notifications with templates, allowing operators to receive informative and actionable alerts.
Best Practices:
Effective Labeling:
- Utilise Prometheus labels effectively to enhance alert grouping and ensure alerts are directed to the right teams.
Silence Rules:
- Implement silence rules judiciously, understanding when to use them and when they might impact incident response negatively.
Testing Configurations:
- Develop a testing strategy for Alertmanager configurations to ensure that changes won’t lead to unexpected behaviours during critical incidents.
Real-world Use Cases:
- Provide examples of how organizations leverage Prometheus Alertmanager in their production environments, solving real-world challenges and improving incident resolution times.
I. Prometheus Alertmanager Installation
(i) Download Alertmanager:
Start by downloading the latest version of Prometheus Alertmanager from the official releases page.
https://github.com/prometheus/alertmanager
$ wget$ tar -xvf alertmanager-0.26.0.linux-amd64.tar.gz
$ cd alertmanager-0.26.0.linux-amd64(iii) Setup Alert Manager Systemd Service
Create a user and group for the Alert Manager to allow permission only for the specific user.
$ groupadd -f alertmanager
$ useradd -g alertmanager - no-create-home - shell /bin/false alertmanager
Creating directories is /etc to store the configuration and library files and change the ownership of the directory only for the specific user.
$ mkdir -p /etc/alertmanager/templates
$ mkdir /etc/alertmanager
$ chown alertmanager:alertmanager /etc/alertmanager
$ chown alertmanager:alertmanager /etc/alertmanager
Copy the alertmanager and amtol [a syntax checker utility] files in the /usr/bin directory and change the group and owner to alertmanager. As well as copy the configuration file alertmanager.yml to the /etc directory and change the owner and group name to alertmanager.
$ cp alertmanager /usr/bin/
$ cp amtool /usr/bin/
$ chown alertmanager:alertmanager /usr/bin/alertmanager
$ chown alertmanager:alertmanager /usr/bin/amtool
$ cp alertmanager.yml /etc/alertmanager/alertmanager.yml
$ chown alertmanager:alertmanager /etc/alertmanager/alertmanager.yml
(iv) Run Alertmanager:
Launch Alertmanager with the configured file:
./alertmanager --config.file=alertmanager.ymlCreate a service file in /etc/systemd/system and the file name is alertmanager.service.
[Unit]
Description=AlertManager
Wants=network-online.target
After=network-online.target
[Service]
User=alertmanager
Group=alertmanager
Type=simple
ExecStart=/usr/bin/alertmanager
- config.file /etc/alertmanager/alertmanager.yml
- storage.path/etc/alertmanager/
[Install]
WantedBy=multi-user.target
After providing the necessary permission to the file reload the background processes and start the Alert Manager service. To prevent the manual restart of the service after reboot, enable the service.
systemctl daemon-reload
systemctl start alertmanager.service
systemctl enable alertmanager.service
(v) To access the Prometheus Alert Manager dashboard over the browser, use the below url and replace the with the vm ip on which alertmanager was installed.
http://<alertmanager-ip>:9093
II. Create Prometheus Rules
Prometheus rules are essential to trigger alerts. Based on the rules, Prometheus will detect and trigger an alert to the Alert Manager.
Below are some basic alert rules,
$ vim /etc/prometheus/alert-rules.yml

groups:
- name: alert_rules
  rules:
  - alert: InstanceDown
    expr: up == 0
    for: 30s
    labels:
      severity: page
    annotations:
      summary: "Instance {{ $labels.instance }} down"
      description: "{{ $labels.instance }} of job {{ $labels.job }} has been down for more than 30 seconds."

  - alert: HostOutOfMemory
    expr: (node_memory_MemAvailable_bytes / node_memory_MemTotal_bytes * 100 < 10) * on(instance) group_left (nodename) node_uname_info{nodename=~".+"}
    for: 10s
    labels:
      severity: warning
    annotations:
      summary: Host out of memory (instance {{ $labels.instance }})
      description: "Node memory is filling up (< 10% left)n  VALUE = {{ $value }}n  LABELS = {{ $labels }}"
  - alert: HostHighCpuLoad
    expr: (sum by (instance) (avg by (mode, instance) (rate(node_cpu_seconds_total{mode!="idle"}[2m]))) > 0.8) * on(instance) group_left (nodename) node_uname_info{nodename=~".+"}
    for: 5m
    labels:
      severity: warning
    annotations:
      summary: Host high CPU load (instance {{ $labels.instance }})
      description: "CPU load is > 80%n  VALUE = {{ $value }}n  LABELS = {{ $labels }}"
  - alert: Jenkins_Service_Down
    expr: node_systemd_unit_state{name="jenkins.service",state="active"} == 0
    for: 1s
    annotations:
      summary: "Instance {{ $labels.instance }} is down"
      description: "{{ $labels.instance }} of job {{ $labels.job }} is down."
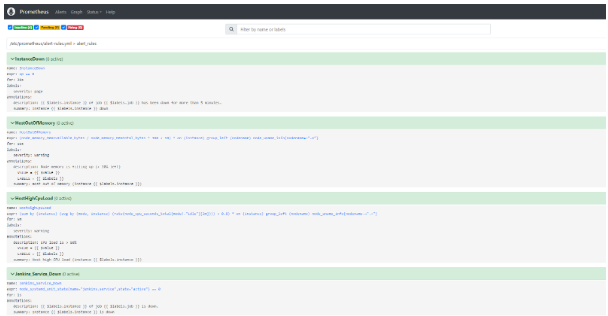
Once the alert rule is added, restart the prometheus.service. The alert rule will appear in the Prometheus console, as shown below.
Create a new email template file and add the following to email.tmp
sudo vi /etc/alertmanager/templates/email.tmpl
{{ define "email" }}
<html>
   <head>
      <style type="text/css">
         table {
         font-family: verdana,arial,sans-serif;
         font-size:11px;
         color:#333333;
         border-width: 1px;
         border-color: #999999;
         border-collapse: collapse;
         }
         table th {
         background-color:#ff6961;
         border-width: 1px;
         padding: 8px;
         border-style: solid;
         border-color: #F54C44;
         }
         table td {
         border-width: 1px;
         padding: 8px;
         border-style: solid;
         border-color: #F54C44;
         text-align: right;
         }
      </style>
   </head>
   <body>
      <table border=1>
         <thead>
           <tr>
        <th>Alert name</th>
        <th>Host</th>
            <th>Summary</th>
            <th>Description</th>
           </tr>
         </thead>

         <tbody>
       {{ range .Alerts }}
            <tr>
         <td>{{ .Labels.alertname }}</td>
         <td>{{ .Annotations.host }}</td>
         <td>{{ .Annotations.summary }}</td>
         <td>{{ .Annotations.description }}</td>
           </tr>
          {{ end }}
         </tbody>

      </table>
  </body>
</html>

{{end}}
FYI
Issue
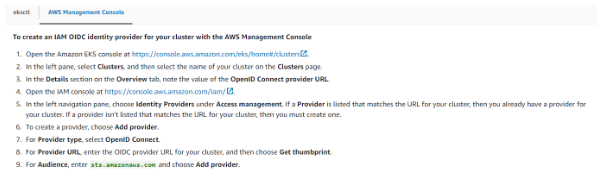
- Error: unable to create iamserviceaccount(s) without IAM OIDC provider enabled
Fix
Note
- Mount secrets by name or ARN
- Mount key/value pairs from a secret [ We chose this ]
- Define a failover Region for a multi-region secret
- Choose a failover secret to mount
Create a secret provider sp.yaml file eg.
apiVersion: apps/v1
kind: Deployment
metadata:
name: test-app-deployment
labels:
app: test-app
spec:
replicas: 1
selector:
matchLabels:
app: test-app
template:
metadata:
labels:
app: test-app
spec:
serviceAccountName: eks-test-sa
volumes:
- name: test-app-secret
csi:
driver: secrets-store.csi.k8s.io
readOnly: true
volumeAttributes:
secretProviderClass: aws-secrets
containers:
- name: test-app
image: nginx
ports:
- containerPort: 80
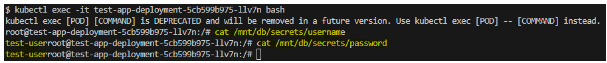
volumeMounts:
- name: test-app-secret
mountPath: "/mnt/db/secrets"
readOnly: trueIssue
error
Fix
Conclusion
We want you to feel confident that you’re getting the most out of your reading time, and that you’ll leave with a better understanding of the subject matter. So relax, and let us do the heavy lifting for you. With iDevopz you can count on getting the information you need in a friendly, accessible way.
If you found this blog helpful, please feel free to share it with your friends. Thanks for checking it out.